Choosing the Right Research Approach
King Abdulaziz University Β· Faculty of Medicine
MSTA112 Β· Week 2
Connecting: Stats (Week 5) & Viz (Week 3) β Design (Today)
You already know how to describe data (Mean/SD). Today we learn how to collect it so your mean and SD actually mean something.
What's NEW Today:
You mastered this in Week 1. We review it because Type determines Design.
| Type | Example | Statistical Test (Week 5) |
|---|---|---|
| Nominal | Blood type | Chi-square |
| Ordinal | Pain scale (0-10) | Mann-Whitney U |
| Discrete | Number of hospitalizations | Counts |
| Continuous | Blood pressure, BMI | Mean Β± SD |
Click here: Which type is "Pain Scale"? (Hint: It's not continuous!)
The variable we manipulate or study.
Example:
Exercise Program
The outcome we measure.
Example:
Weight Loss
NEW Today: Study design limits the relationship we can claim (Association vs Causation).
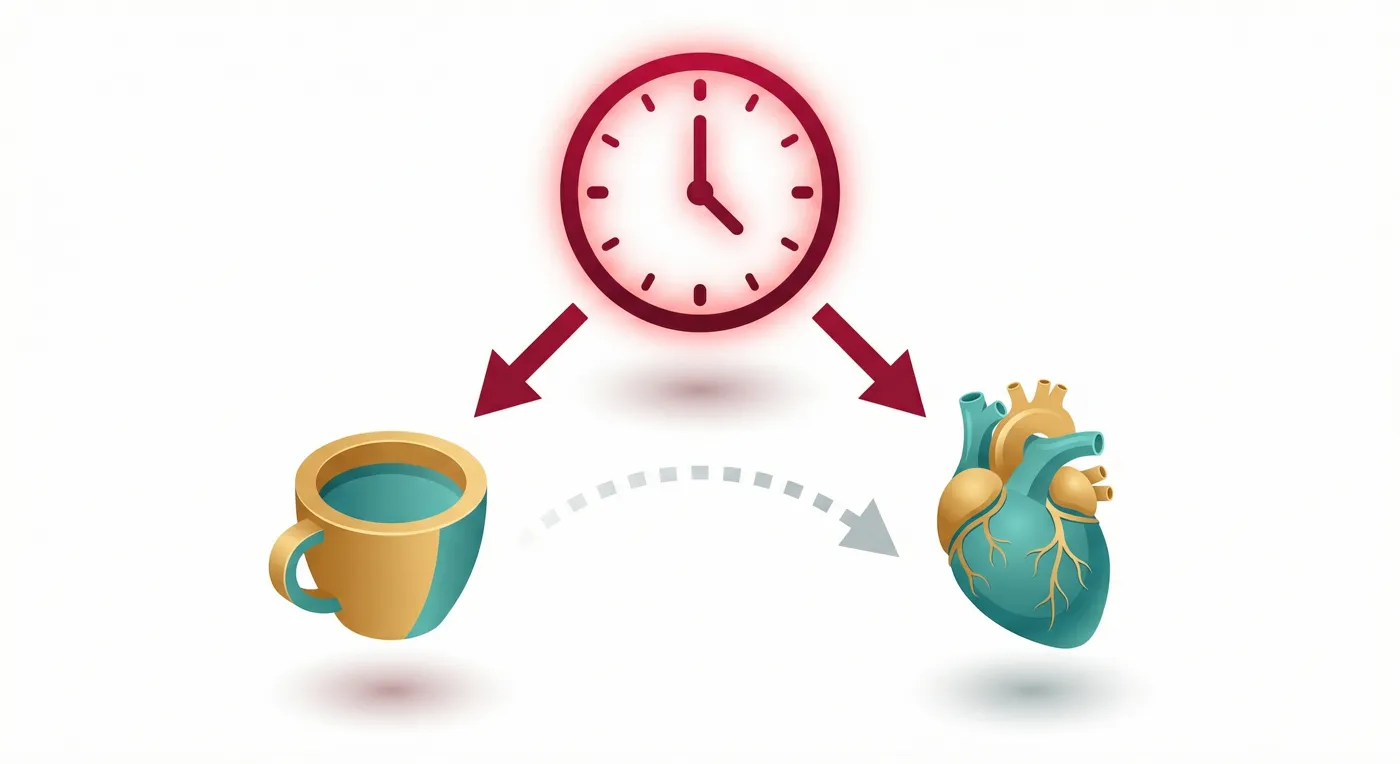
Just because two things correlate, doesn't mean one causes the other.
Observation: Coffee drinkers have less heart disease.
Hidden Reality: Age affects both!
Association (Bottom)
Causation (Top)
| Feature | Observational | Experimental (RCT) |
|---|---|---|
| Researcher Role | Observes Nature | Manipulates Exposure |
| Assignment | Natural | Random Assignment |
| Causation? | Difficult | YES |
| Cost & Time | Lower | Higher |
Key Insight: Observational studies can suggest, but only experiments can prove.
Hierarchy of Evidence: Not all studies are equal. RCTs and Meta-Analyses provide the strongest evidence for causation.
Confounding is Key: Always ask "What's the hidden variable?" A good study design aims to control for confounders.
Variables Matter: The type of variable (Nominal, Ordinal, Continuous) and its role (Independent, Dependent) dictate your entire research plan.
Module 2
Cross-Sectional Β· Case-Control Β· Cohort Β· RCT
Measure exposure + outcome at the same time.
Surveyed 10,000 households once.
Found: Mean BMI = 29.4 kg/mΒ² Β· 23.9% have diabetes
Did obesity cause diabetes, or did diabetes cause weight change? We don't know.
π Key Metrics: Prevalence Β· Mean Β± SD Β· Proportions Β· Chi-square (ΟΒ²)
Cannot calculate: Risk Ratio, Odds Ratio, Incidence Rate (no time component)
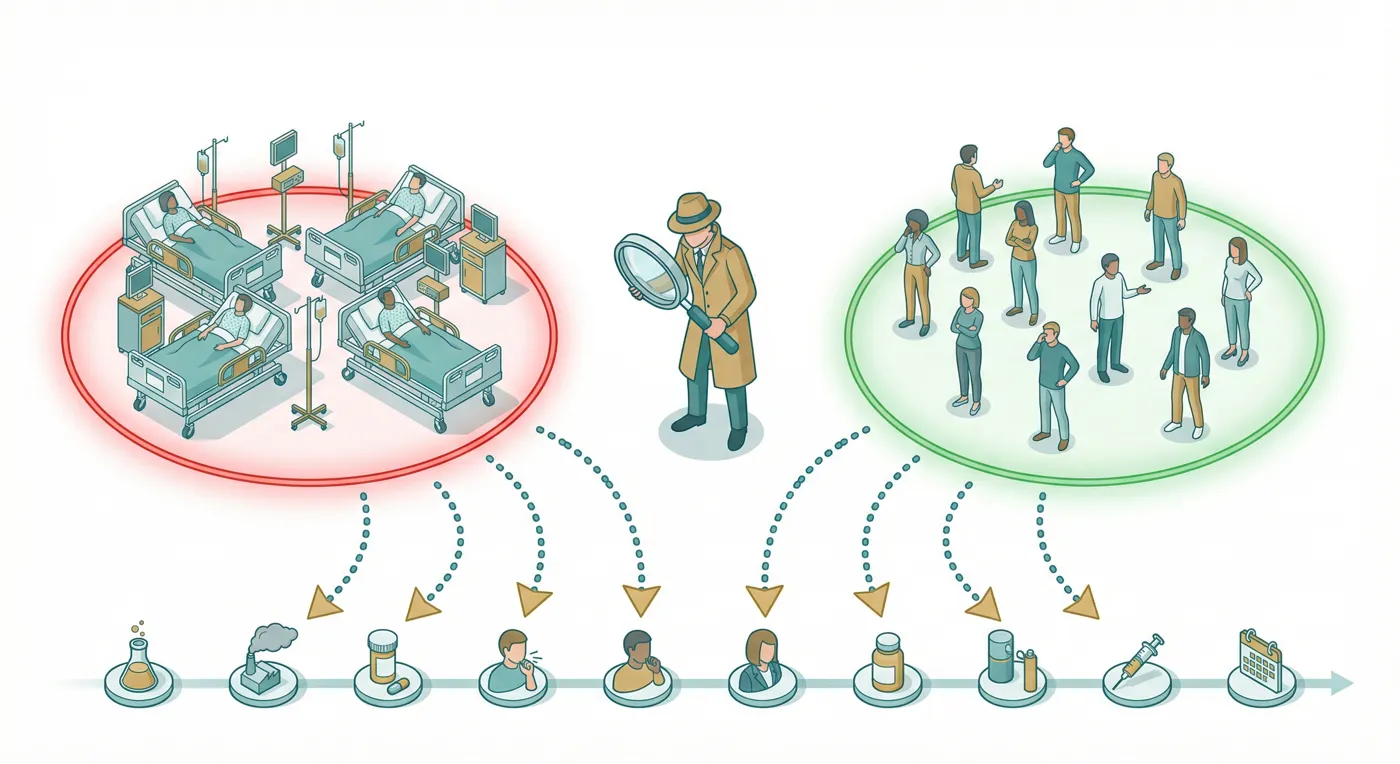
Best For: Rare diseases (MERS-CoV).
| Group | Camel Exposure |
|---|---|
| MERS Cases (100) | 75% |
| Healthy Controls (100) | 15% |
Odds Ratio = 17.0 (17Γ higher odds if exposed)
π Key Metric: Odds Ratio (OR)
OR = (a/c) Γ· (b/d) Β· OR > 1 = higher risk Β· OR = 1 = no association Β· 95% CI must not cross 1
Strength: Proven time sequence.
Baseline (2009): Measured Diet. Follow-up (2019):
Risk Ratio = 2.3x
π Key Metrics: Risk Ratio (RR) Β· Hazard Ratio (HR) Β· Incidence Rate
RR = Risk(exposed) Γ· Risk(unexposed) Β· HR from Cox regression Β· Can also compute Attributable Risk (AR)
Randomization is the magic ingredient. It balances Age, Gender, Wealth, AND unknown factors between groups.
If Group A does better, it MUST be the treatment.
1,200 Participants Randomized
Efficacy = 95%
Can we claim Causation? YES. β
π Key Metrics: RR / OR Β· ARR Β· NNT Β· p-value
ARR = |Riskβ β Riskβ| Β· NNT = 1/ARR Β· "Treat 20 patients to prevent 1 event" Β· ITT vs Per-Protocol analysis
| Design | Direction | Causation? | Key Metric | Saudi Example |
|---|---|---|---|---|
| Cross-Sectional | π· Snapshot | NO | Prevalence, Mean Β± SD | SHIS |
| Case-Control | βͺ Backward | NO | Odds Ratio (OR) | MERS |
| Cohort | β© Forward | Suggests | RR, HR, Incidence | PURE-Saudi |
| RCT | β© Forward | YES | ARR, NNT, RR | Vaccine Trial |
Instead of doing one study, we find ALL studies on a topic and combine their statistics.
Larger sample size = More precise estimate.
π Top of the Evidence Pyramid.
Combined: 47 distinct studies (including SHIS).
Total Sample: 180,000 people.
Pooled Prevalence: 20.8%
(95% CI: 18.1 β 23.5%)
π Key Metrics: Pooled Effect Size Β· IΒ² (Heterogeneity) Β· Forest Plot Β· Funnel Plot
IΒ² < 25% = low heterogeneity Β· Fixed vs Random effects model Β· Funnel plot asymmetry β publication bias
Practice: "Does air pollution cause asthma?" β Cohort (Unethical to randomize).
Time is the Decider: Cross-sectional (snapshot), Case-control (backwards), Cohort/RCT (forwards). The direction determines what you can conclude.
Randomization is Power: Only RCTs, through random assignment, can reliably control for both known and unknown confounders to establish causality.
Fit the Design to the Question: Use Case-Control for rare diseases, Cohort for risk factors, Cross-sectional for prevalence, and RCTs for interventions.
Module 3
From Population to Sample β Without Bias
Selection Bias: If your sample doesn't look like the population, your results are wrong.
| Method | How It Works | Bias Risk | When to Use |
|---|---|---|---|
| Simple Random | π² Lottery | LOW | Homogeneous populations |
| Stratified | π Subgroups first | LOW | Ensure subgroup rep |
| Cluster | ποΈ Pick entire groups | MEDIUM | Large areas |
| Convenience | πΆ Whoever is available | HIGH | Pilot studies ONLY |
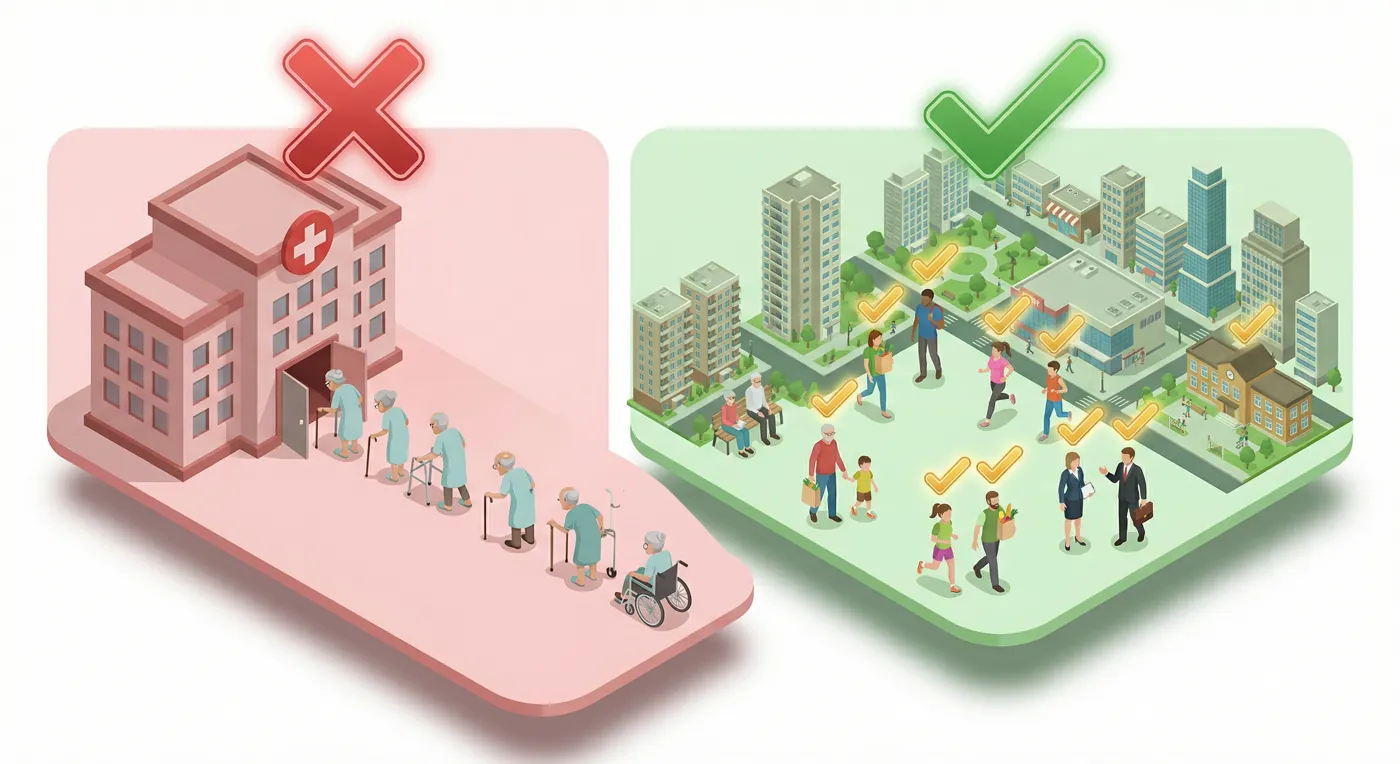
Method: Survey patients at KAU Hospital.
Result: 65% Obesity
Mean BMI: 32.4 kg/mΒ²
Why? Hospital patients are sicker than average.
Method: Random national ID sample.
Result: 35% Obesity
Mean BMI: 29.4 kg/mΒ²
Why? Represents everyone.
Selection Bias = 30% Overestimate!
PURE-Saudi split the population into strata (layers) to ensure fair representation.
| Stratum | Population % | Sample Size | Why? |
|---|---|---|---|
| Urban | 83% | 1,699 | Most Saudis live here. |
| Rural | 17% | 348 | Different lifestyle. |
| Gender | 50/50 | 1,044 M / 1,003 F | Balanced. |
Goal is Generalizability: A good sample accurately reflects the entire population, allowing you to generalize your findings.
Convenience Kills Validity: Convenience sampling is the easiest method but introduces severe selection bias, making results unreliable.
Stratify for Accuracy: Use Stratified Sampling when you have important subgroups (like urban/rural) to ensure each is fairly represented in your sample.
Module 4
The enemies of valid research
π―
Sample β Population
Ex: Hospital study
π§
Bad memory
Ex: Case-Control studies
π
Bad tools/procedure
Ex: Uncalibrated BP cuff
π»
Hidden variable
Ex: Age affects result
Naive Conclusion: Coffee protects the heart.
Reality: The "Coffee Drinkers" group was different.
It wasn't the coffee. It was the Age, Exercise, and Wealth.
| Confounder | β Coffee | π« Non-Drinkers |
|---|---|---|
| Mean Age | 35 Years | 55 Years |
| Exercise | 65% | 30% |
| Wealth | High | Low |
| Strategy | Prevents Which Bias? | Study Type |
|---|---|---|
| π² Randomization | Confounding | RCTs |
| π Blinding | Observer/Participant Bias | RCTs |
| π Standardization | Measurement Bias | All Studies |
| π Medical Records | Recall Bias | Case-Control |
Before you choose a design, fill in the blanks.
Population
Saudi adults (40-65) with Pre-diabetes
Intervention
Supervised Exercise
Comparison
Standard Care
Outcome
Diabetes Incidence
Can we randomize? YES β Design: RCT Β· Sampling: Stratified Random
PICO is your Blueprint: A well-defined PICO question makes choosing the right study design and sampling method straightforward.
Anticipate and Neutralize Bias: Good research isn't about avoiding bias entirely (that's impossible), but about recognizing potential biases (Selection, Recall, etc.) and actively using strategies like randomization and blinding to minimize their impact.
The Chain of Validity: Your final conclusion is only as strong as the weakest link in your research chain: PICO β Design β Sampling β Bias Control. A flaw in any one part compromises the entire study.
Built by Aqrab β AI study-design review
Visit Aqrab β